

On Friday, July 3, Bitcoin (BTC) managed to challenge the $63,000 level but could not surpass it. The rise, which started at $58.5 thousand at the beginning of the month, seems to continue.
Overleveraged short positions were caught off guard by this move, according to AMBCrypto. For Bitcoin alone, $143 million in short liquidations have been recorded so far this month.
Heavy spot ETF outflows suggested that most weak hands may have left the market and the recent move may have been a reversal to the upside rather than just a decline. short squeeze.
Overall BTC supply limits any recovery efforts
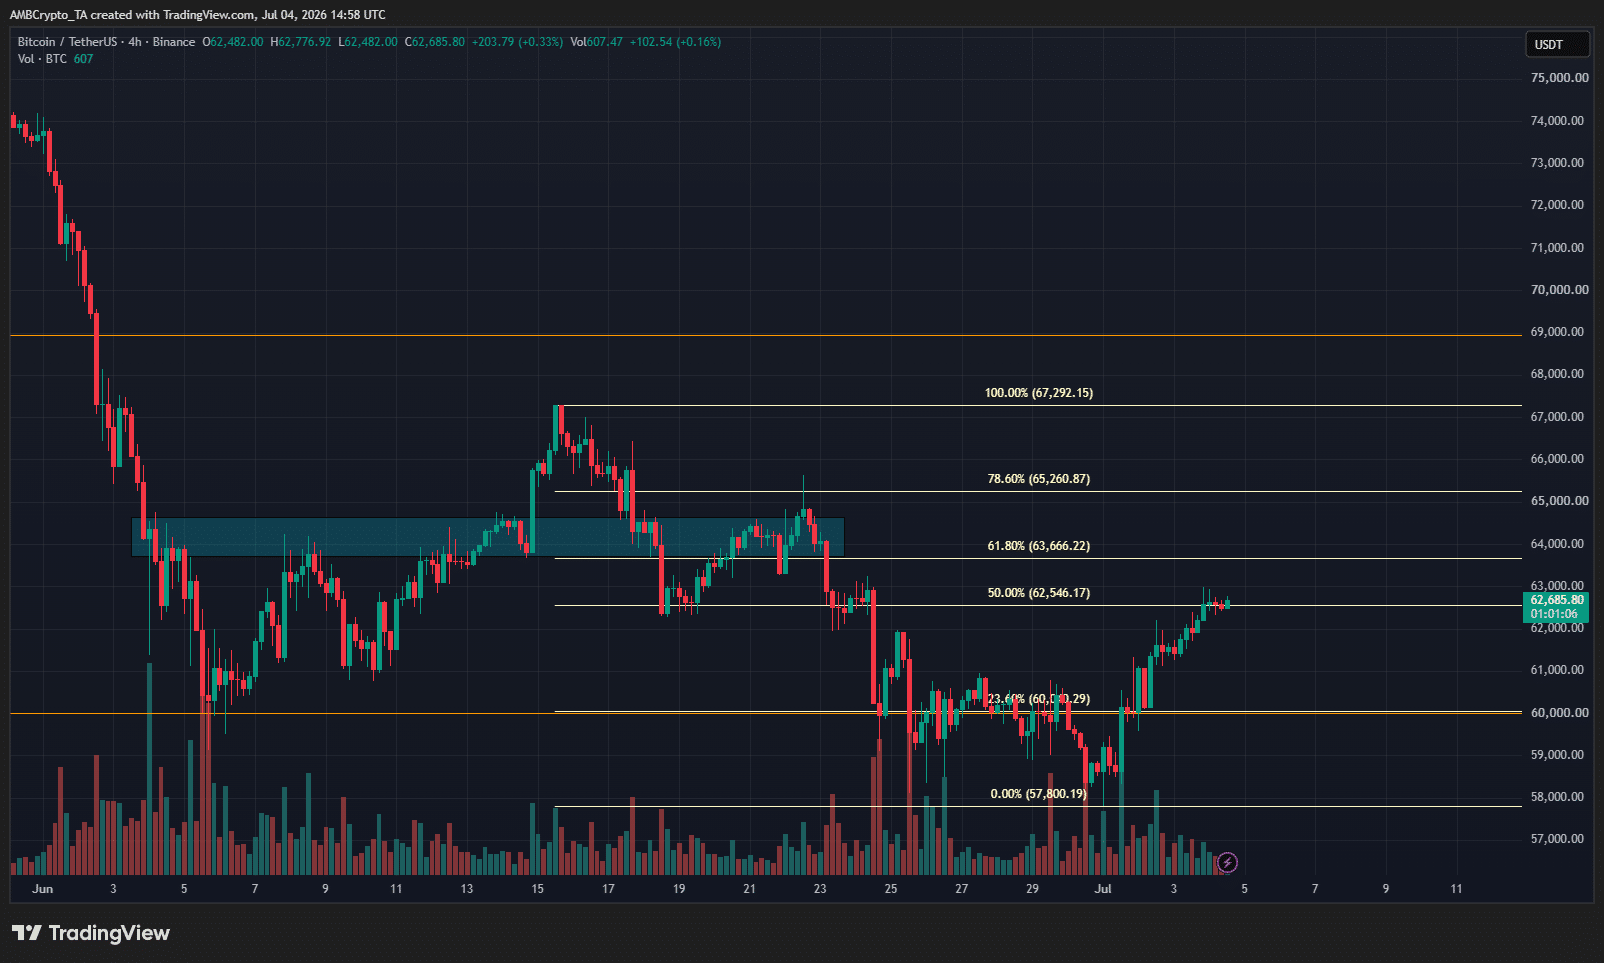
The 4-hour chart revealed a bearish price structure for BTC at the time of writing.
Depending on the Fibonacci retracement levels, a bounce to $65.2 thousand may be possible.
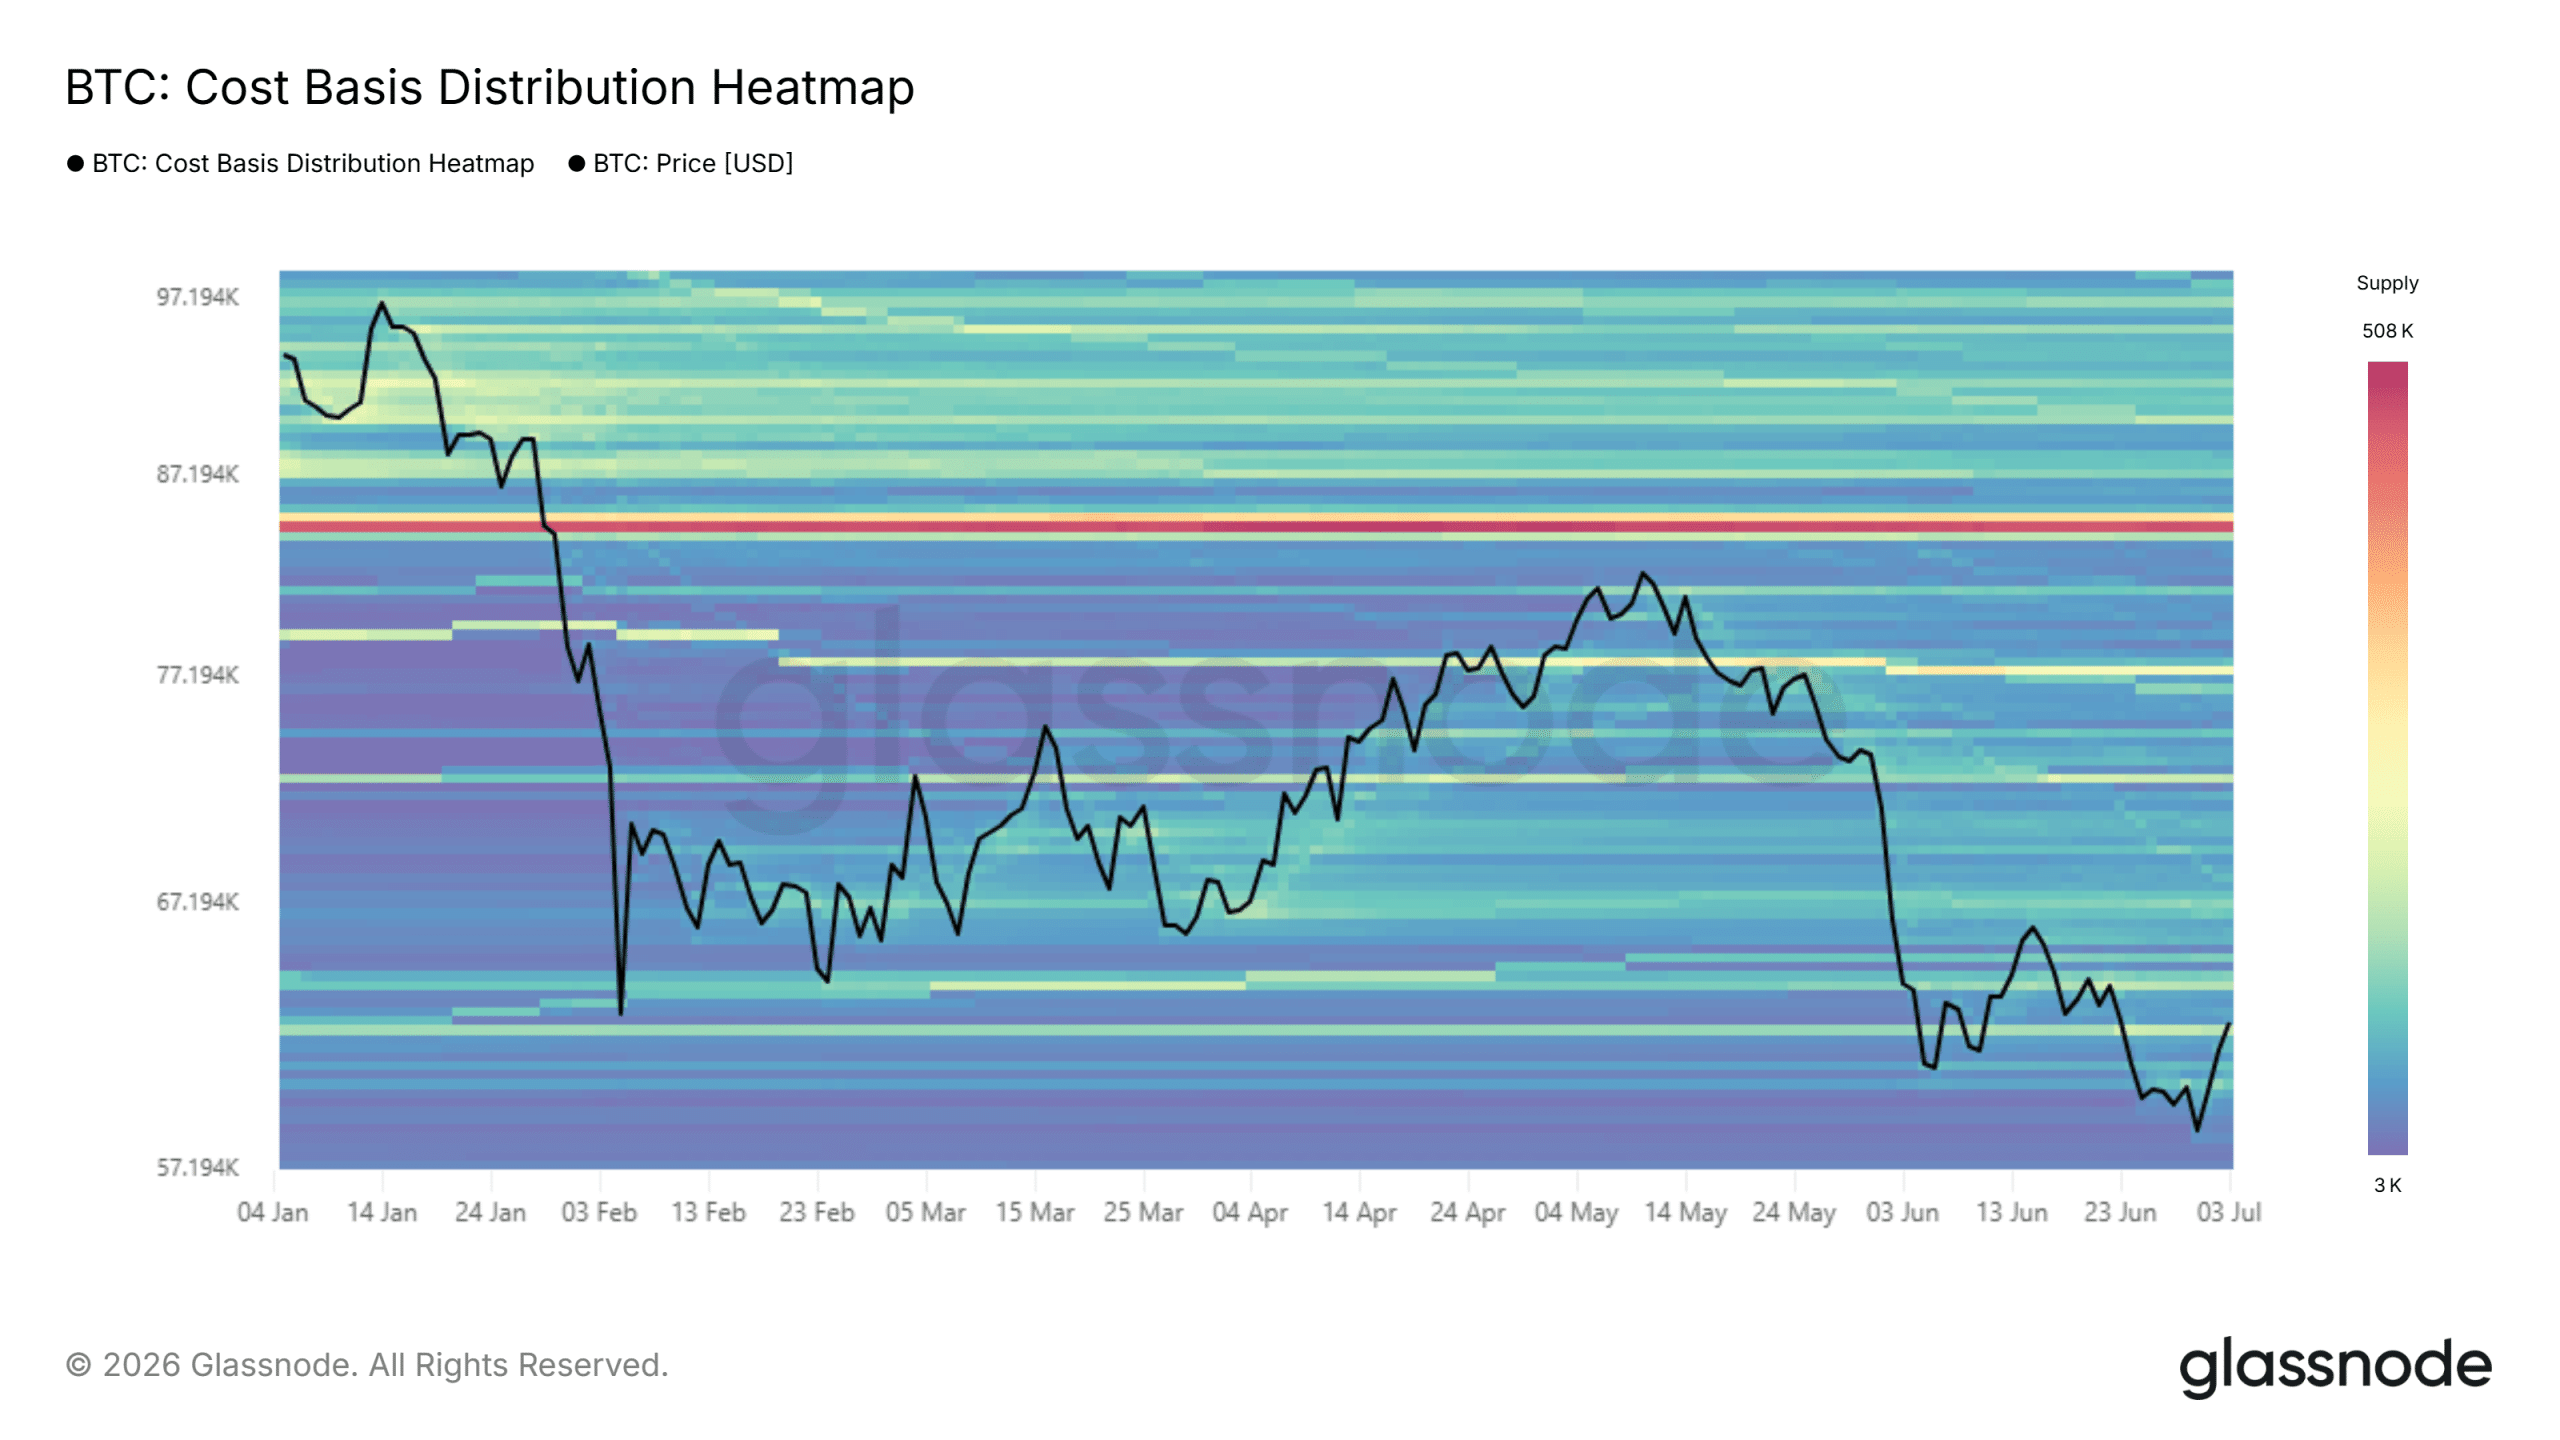
Zooming out, the Cost-Based Distribution chart highlighted the $64k and $67k levels as immediate clusters where a large amount of BTC was purchased. There was also significant supply at the $72.3 thousand and $77.2 thousand levels.
This means that in a significant splash scenario, underwater owners Bitcoin At these price levels, it may consider exiting the market at the break-even point. Large selling waves can impact short-term bullish momentum.
Signs of major Bitcoin volatility are approaching
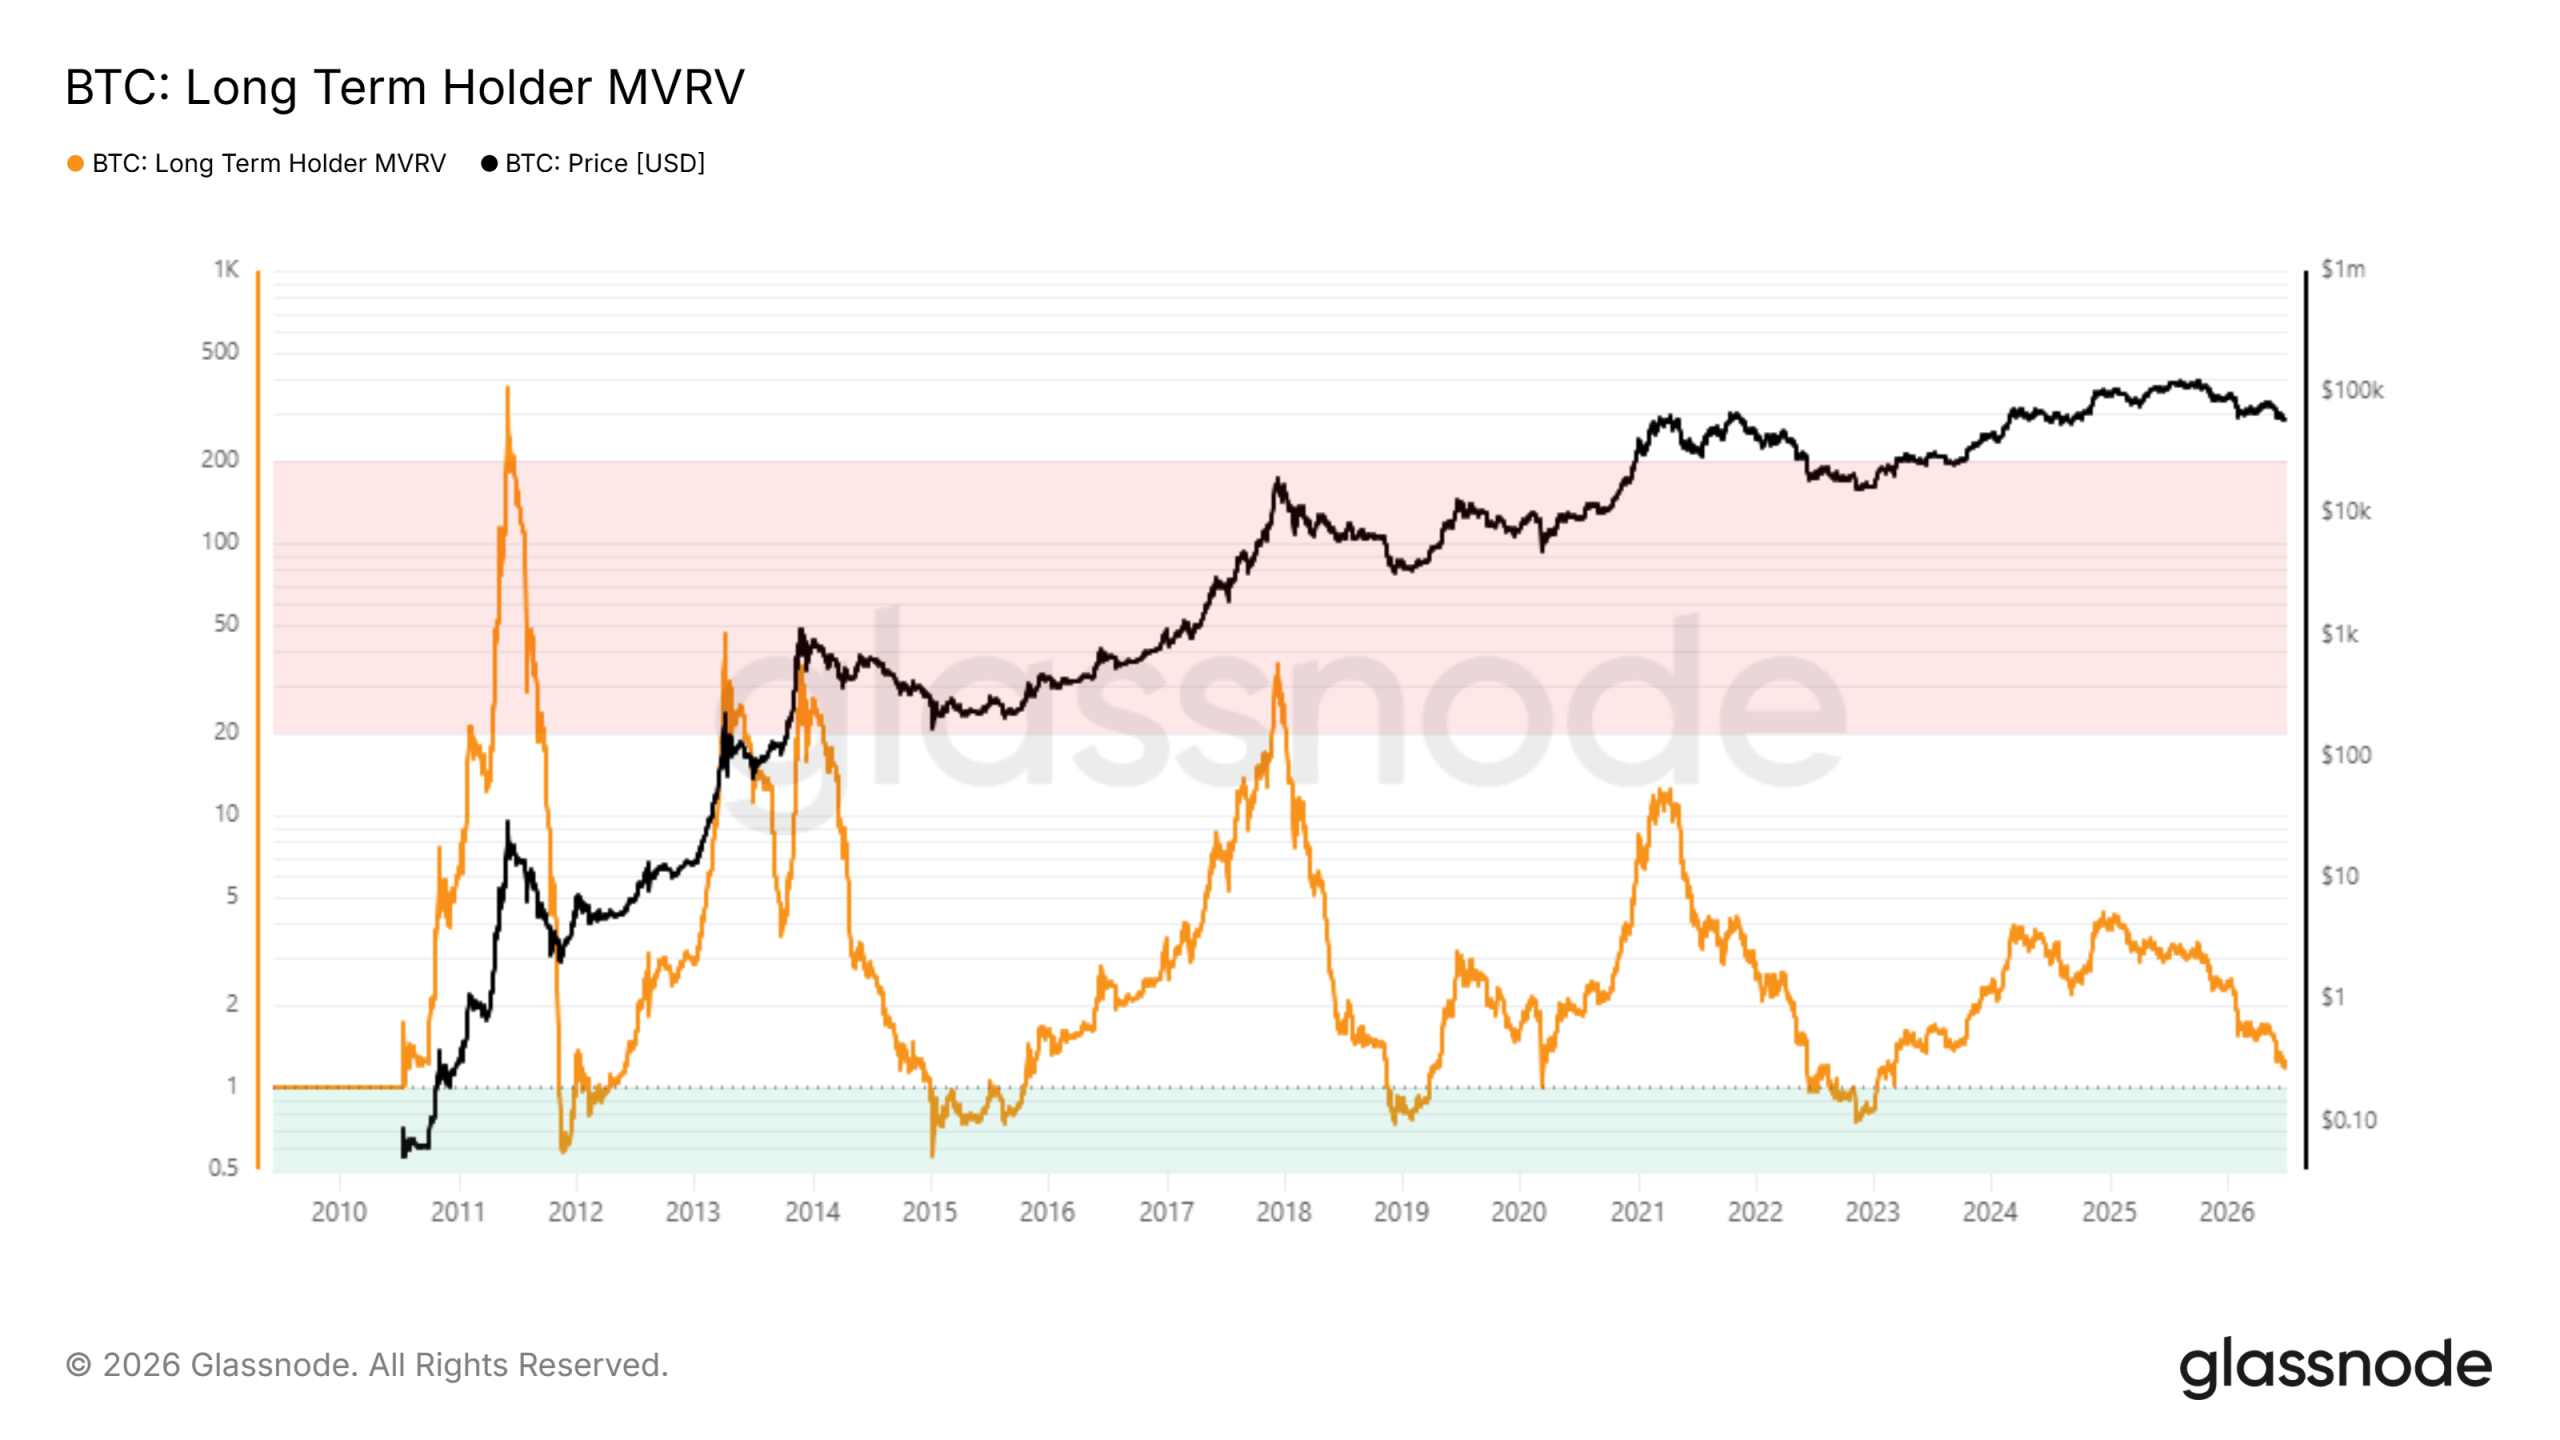
Long-term holder MVRV compares the current market price to the total cost basis of holders who have held their BTC for 155 days or longer. When the MVRV of this group of long-term holders falls below 1, this means that even these market participants may be in unprofitable positions on average.
Every Bitcoin cycle so far has seen deep price corrections and LTH despair. However, in 2026, LTH MVRV has not yet fallen below 1. At the time of this writing, it had a value of 1.26.
One CryptoQuant Insights In its post, XWIN Japan pointed out the sharp increase in BTC inflows to the exchanges towards the end of June. This trend was also valid for Ethereum and the altcoin sector.
Large inflows show that capital is flowing into the entire crypto sector, not just a few select assets.
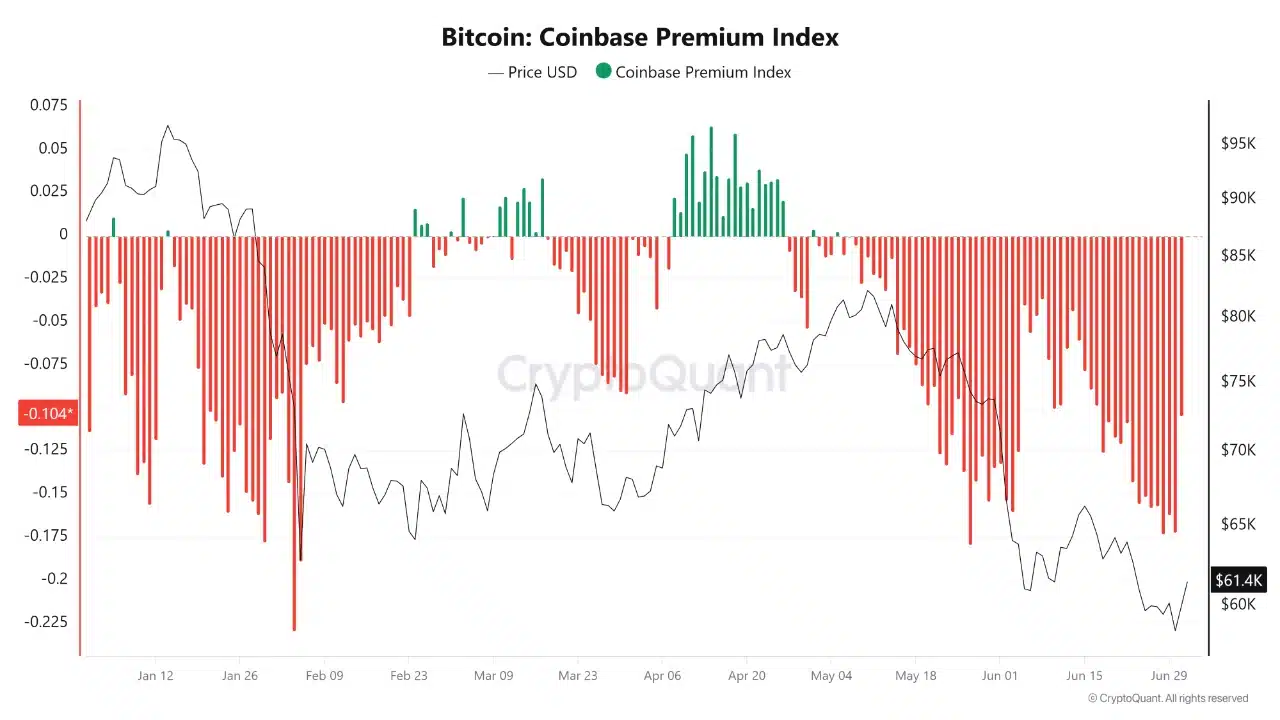
Factors such as deeply negative ETF flows, declining apparent demand, and a negative Coinbase Premium Index indicated a lack of buying pressure in the market.
If liquidity conditions are also taken into account, a decisive price movement may come soon.
Final Summary
- Bitcoin’s price structure is in a downward trend and a jump to $65,000 to $67,000 may be possible in the short term.
- Long-term market bottoms are often marked by capitulations, and a decisive price move may be on the horizon.