

Jito (JTO) is on the profitable side of the market from a broader perspective.
Year-to-date, the asset has seen a 42% increase in price, but sentiment is slowly changing as sellers take control of the latest price trajectory for its native token, JTO.
The asset retreated with a loss of 11.59% in the past day as the bears continued their rise. This exposes JTO to further downside risk.
$59 million TVL drop frustrates JTO
There has been a significant capital squeeze in the market and this is directly linked to the on-chain performance of total value locked (TVL).
TVL fell more than $59 million during this period from its July 23 high of $791.02 million.
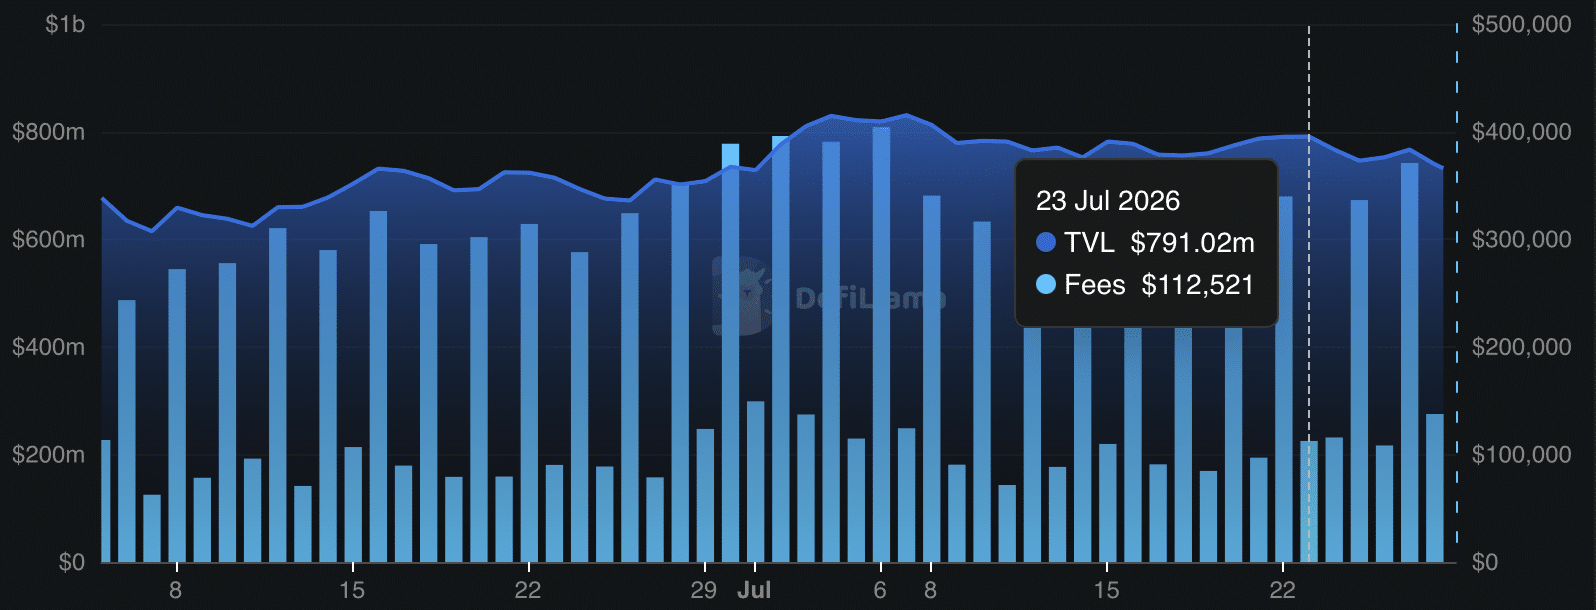
TVL measures the health of a protocol, and rising metrics generally mean investors are taking a long-term view on a protocol’s native token. A sharp decline indicates panic and a market full of sellers.
The contraction is also spreading to centralized exchanges, where the derivatives market shows Open Interest (OI) falling. At press time, OI is down 16% with net flows of $1.62 million, deepening the bearish outlook and pushing JTO towards the lower end of the market.
Jito gains keep bulls in the game
The bears have not completely spoiled the outlook, as some bullish structures remain and point to a possible recovery.
DeFiLlama’s earnings data for Jito shows that the protocol generated more revenue in July than in June, with three more days of data to come.
July’s figure came to roughly $324,000; Although the price has fallen 32% over the past thirty days in a downtrend market, it is still a slight improvement from June’s high of around $312,000.

Similarly, the Funding Rate remained positive with a reading of 0.0027% as of press time. This indicates that the majority of the capital (approximately $47.14 million) preferred long JTO positions over sellers in the market.
Due to the solid performance of the protocol and the upward trend of criminals’ capital, JTO There is still a chance for recovery in the near term.
JTO liquidation clusters point higher
The liquidation heat map shows a clear and intense cluster band above the current price level on the chart.
Clusters mark areas where investors place buy or sell orders, and these areas act as magnets, pulling prices towards them.
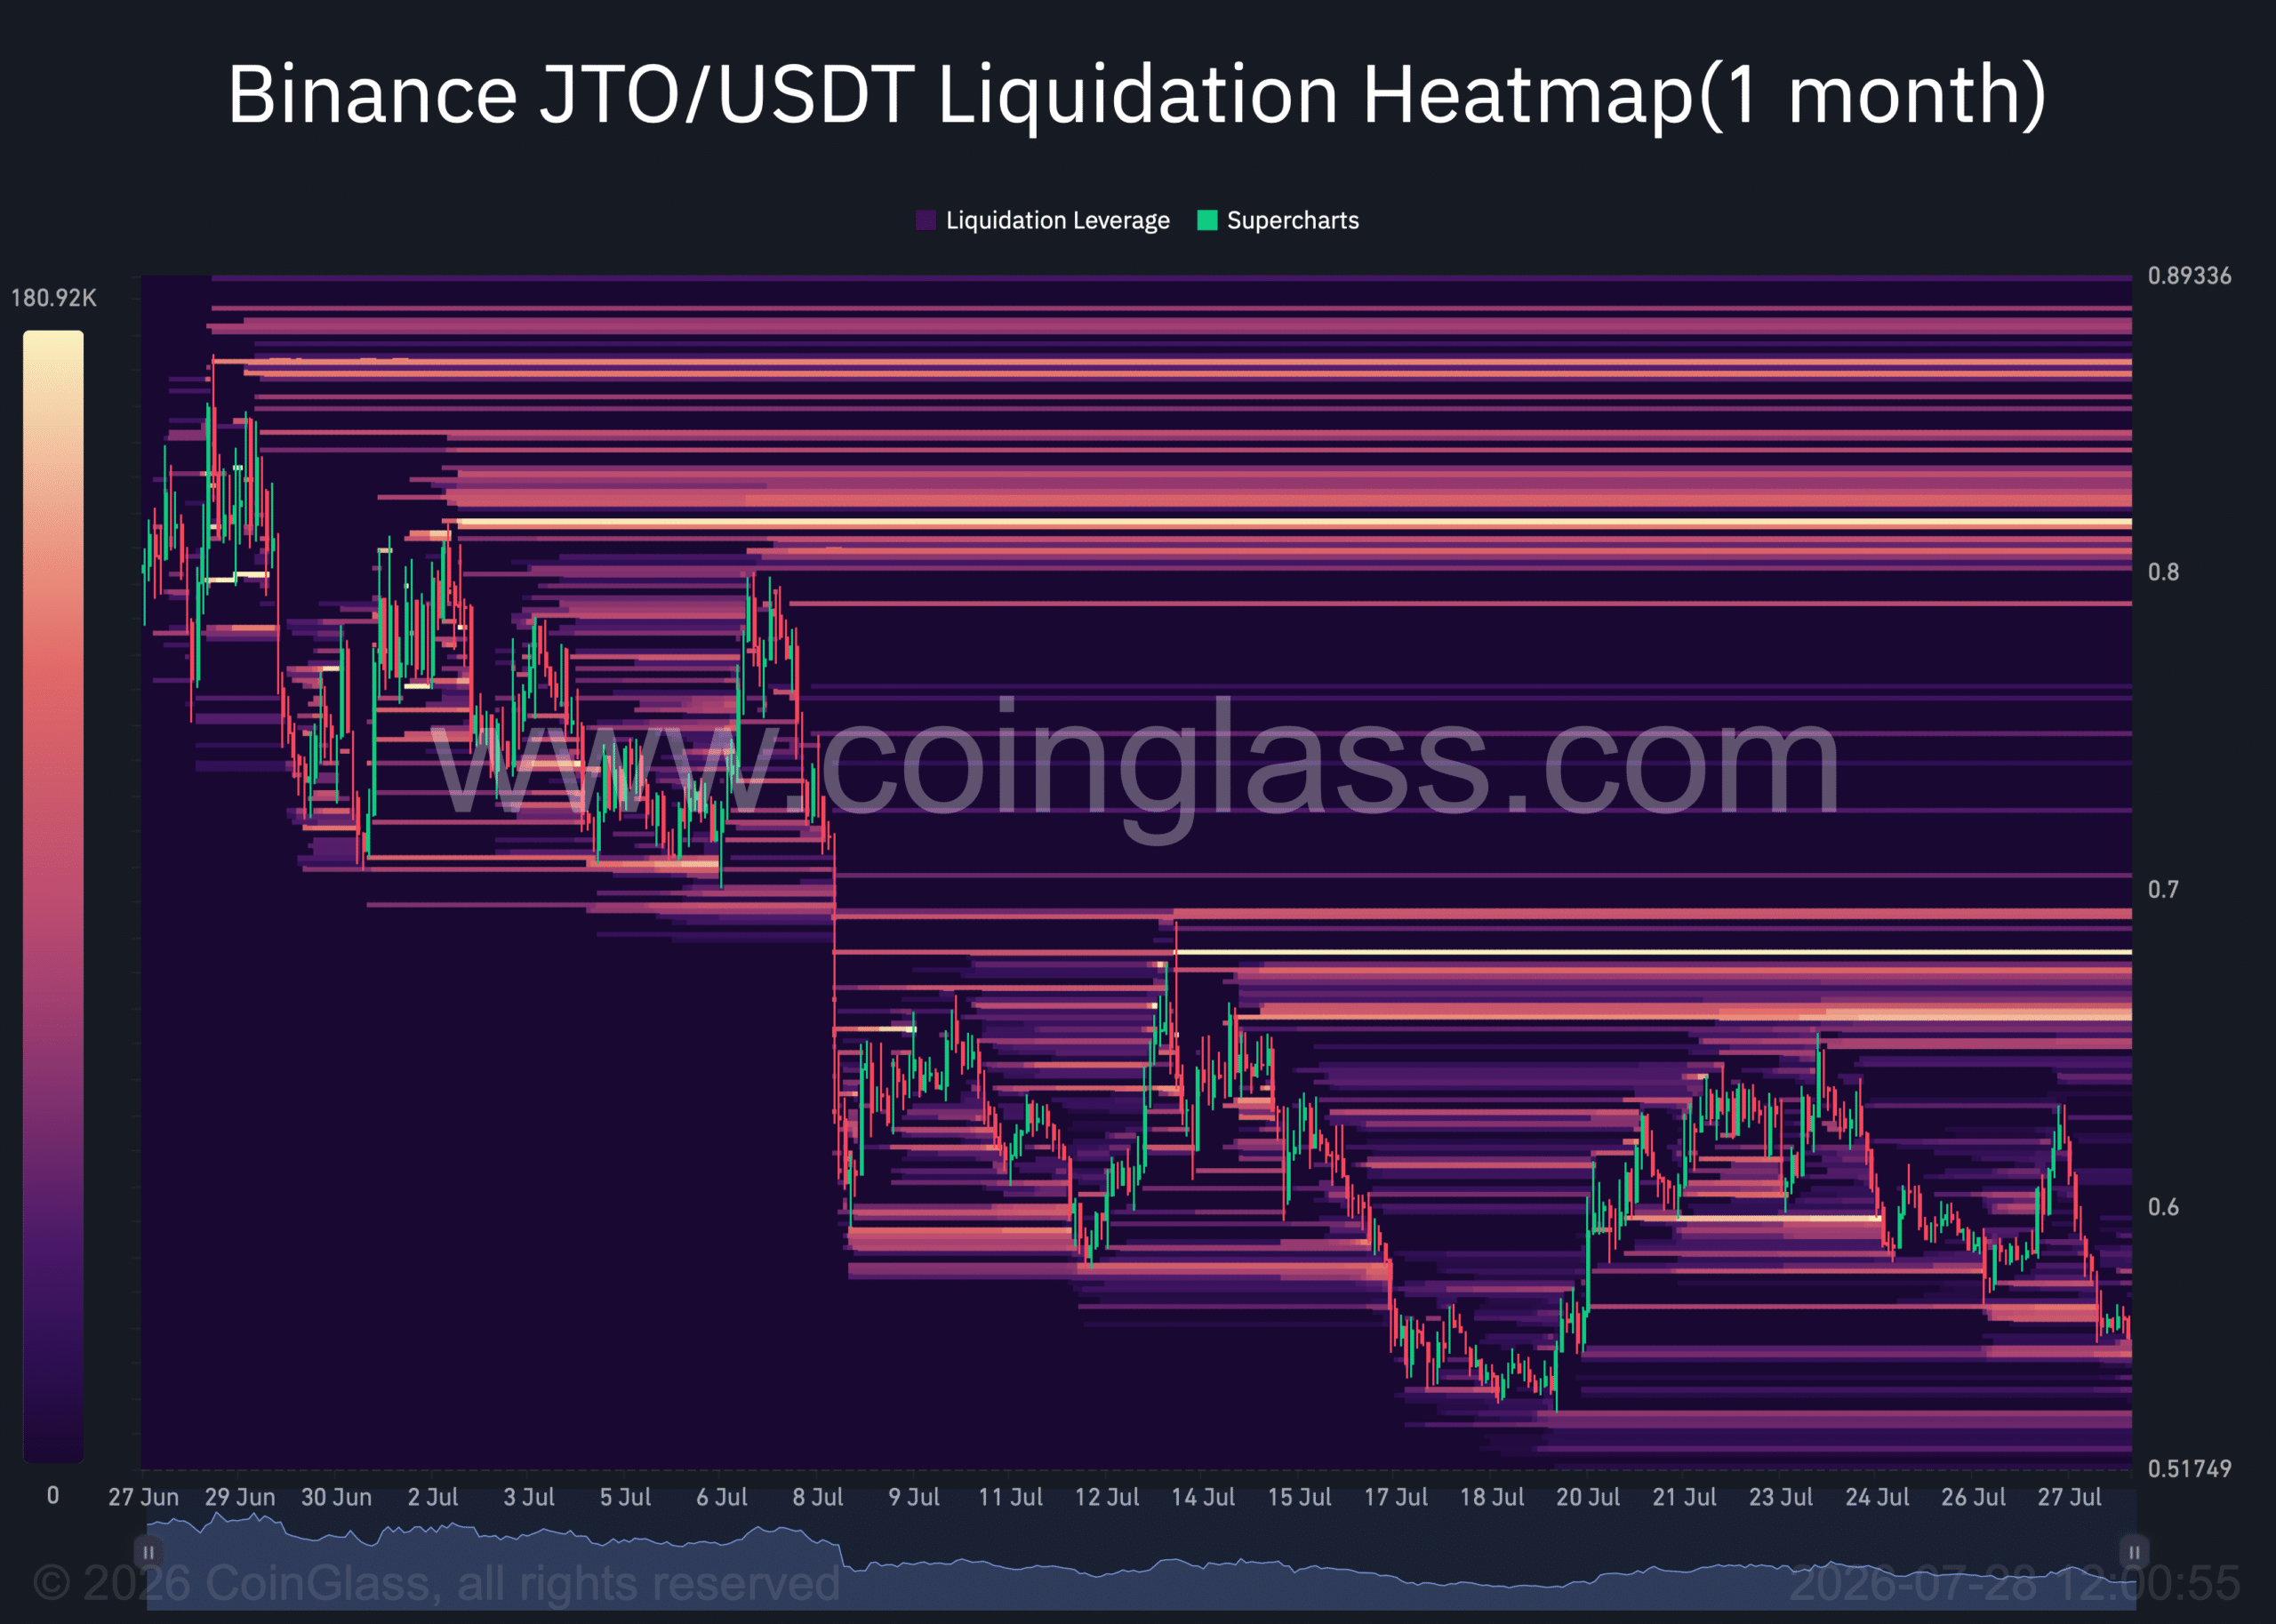
At the time of writing, most of the clusters are heavily concentrated well above the price. But the thinner cluster below the price allows JTO to move lower and extend its existing losses. More importantly, a recovery is on the horizon.
Final Summary
- Jito’s total value locked (TVL) has fallen by more than $59 million since July 23.
- July earnings exceeded June totals and the Funding Rate remained positive, putting JTO on the path to recovery.