

Bitcoin has lost more than half its value since its peak in October 2025, drifting to around $63,000 at press time. It is currently largely in a narrow range between $58,000 and $63,000.
The decline is largely due to increased geopolitical tensions after the peak (the US-China tariff war and the unresolved West Asia dispute), which is driving capital out of the market. bitcoin.
Sentiment has since settled on the geopolitical front, but moves by major investors have cast doubt on whether a sustainable rally is coming. Michael Saylor’s Strategy recently sold $216 million worth of Bitcoin to fund dividend payoutThis sharpens the uncertainty. On-chain data offers a clearer answer.
Bitcoin’s apparent demand points to quiet accumulation
Despite the outflows, Bitcoin’s apparent demand on a 30-day basis points to a quiet and growing accumulation of the asset.
Since June 3, buyers have collected nearly 200,000 Bitcoins, increasing apparent demand from -275,000 Bitcoins to -75,000 Bitcoins. The metric measures the gap between newly mined Bitcoin and inactive supply.
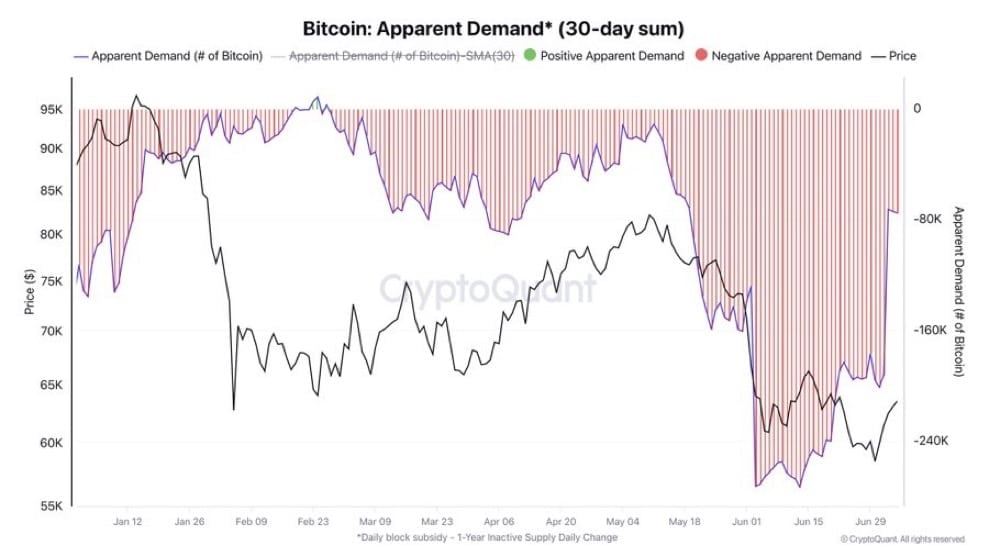
The rise reflects some accumulation but falls short of confirming a bullish market.
Apparent demand is still in the negative territory on the chart. While the upward push remains weak, especially towards the positive end, a significant rise seems unlikely until the metric turns positive. For now, the trend calls for caution rather than bullishness, and the market has yet to confirm otherwise.
Structure indicates limited negativity
Structurally, the king cryptocurrency is showing signs that further downside movement from this level is less likely.
Bitcoin found a bottom in the lower band of the Bollinger Bands (green line); This level has often played a critical support role if the price trades there for a while.
Bollinger Bands have repeatedly marked recovery points on the chart. Each of the last five examples circled in red generally moved the price to the blue or upper red line; It currently stands at $69,928 and $82,544.
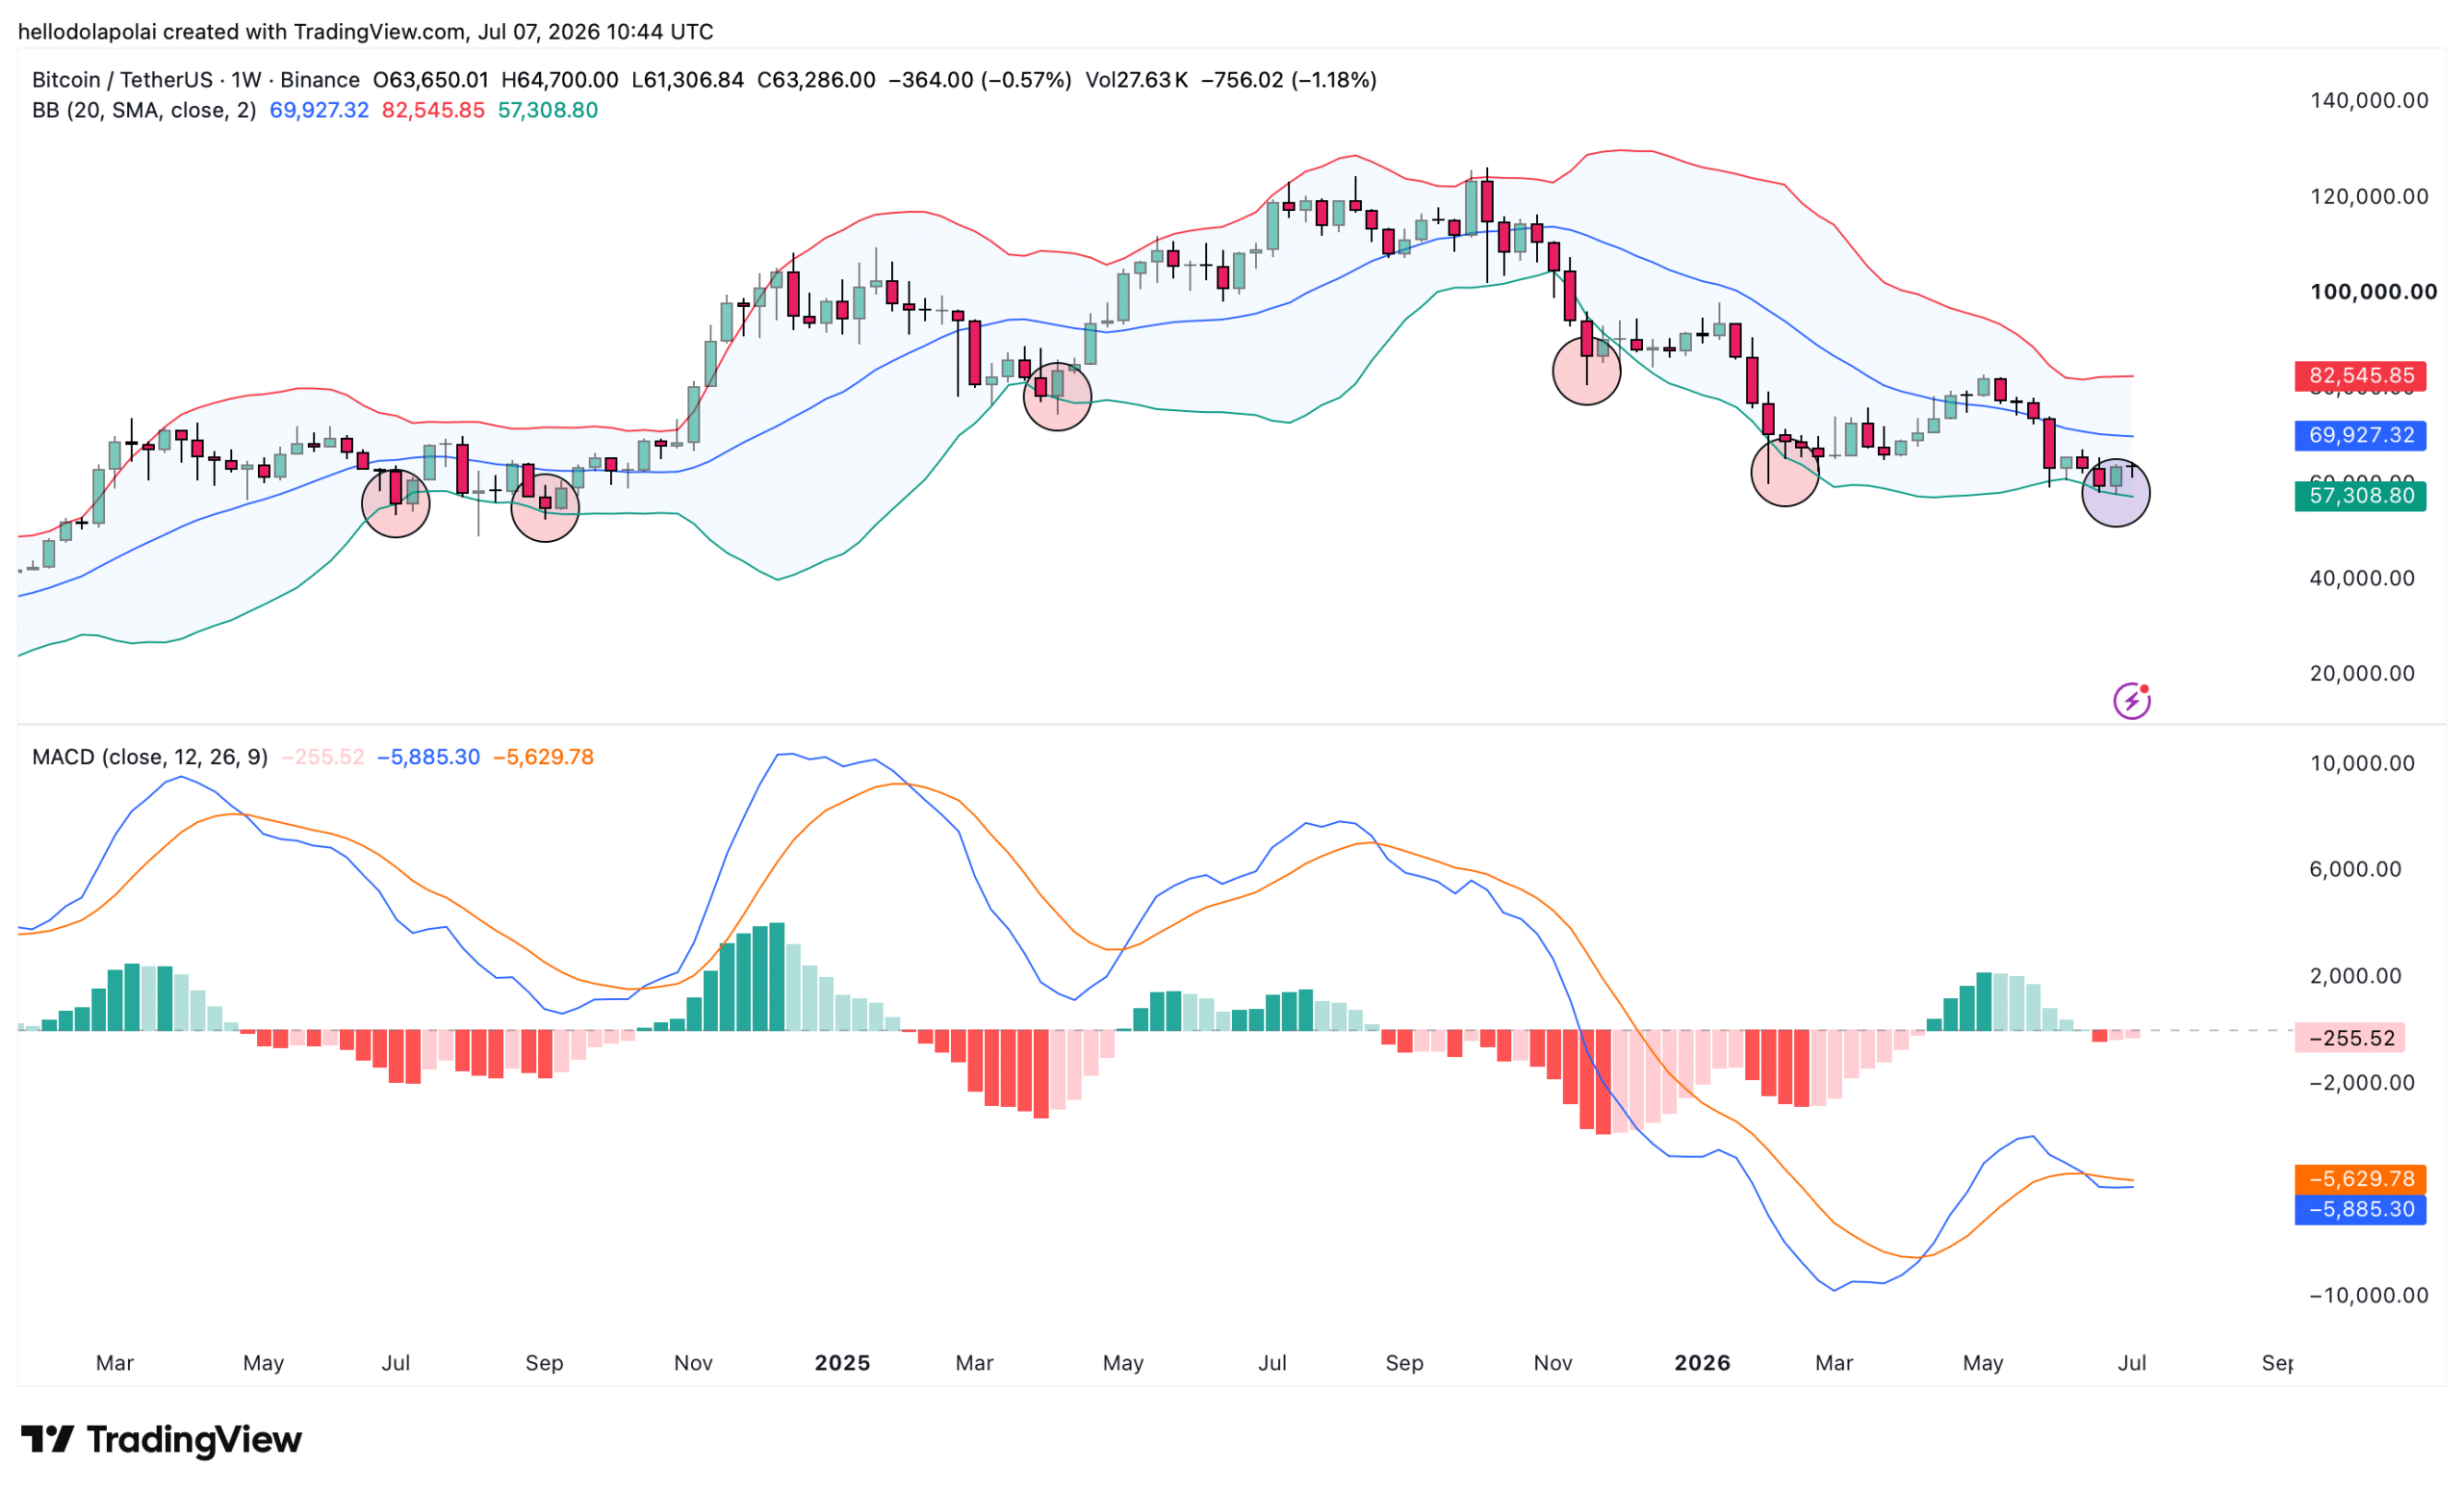
On the other hand, the moving average convergence divergence (MACD) indicator indicates that a rally may not happen anytime soon, with Bitcoin more likely to move slightly lower or consolidate further within its current range.
The MACD blue line crossing the orange line (while maintaining a narrow range) means that Bitcoin continues to trade in the direction it is currently in, between $58,000 and $63,000, before any uptrend occurs. This also shows that the likelihood of an extreme decline remains slim.
Bitcoin seasonal index and foreign exchange reserves remain calm
The market has not entered the Bitcoin season, which is an exuberant period when the asset reaches new local highs and potentially tests a new all-time high.
The index that tracks this is currently reading 52, providing modest support to the view that select altcoins are attracting renewed capital flows.
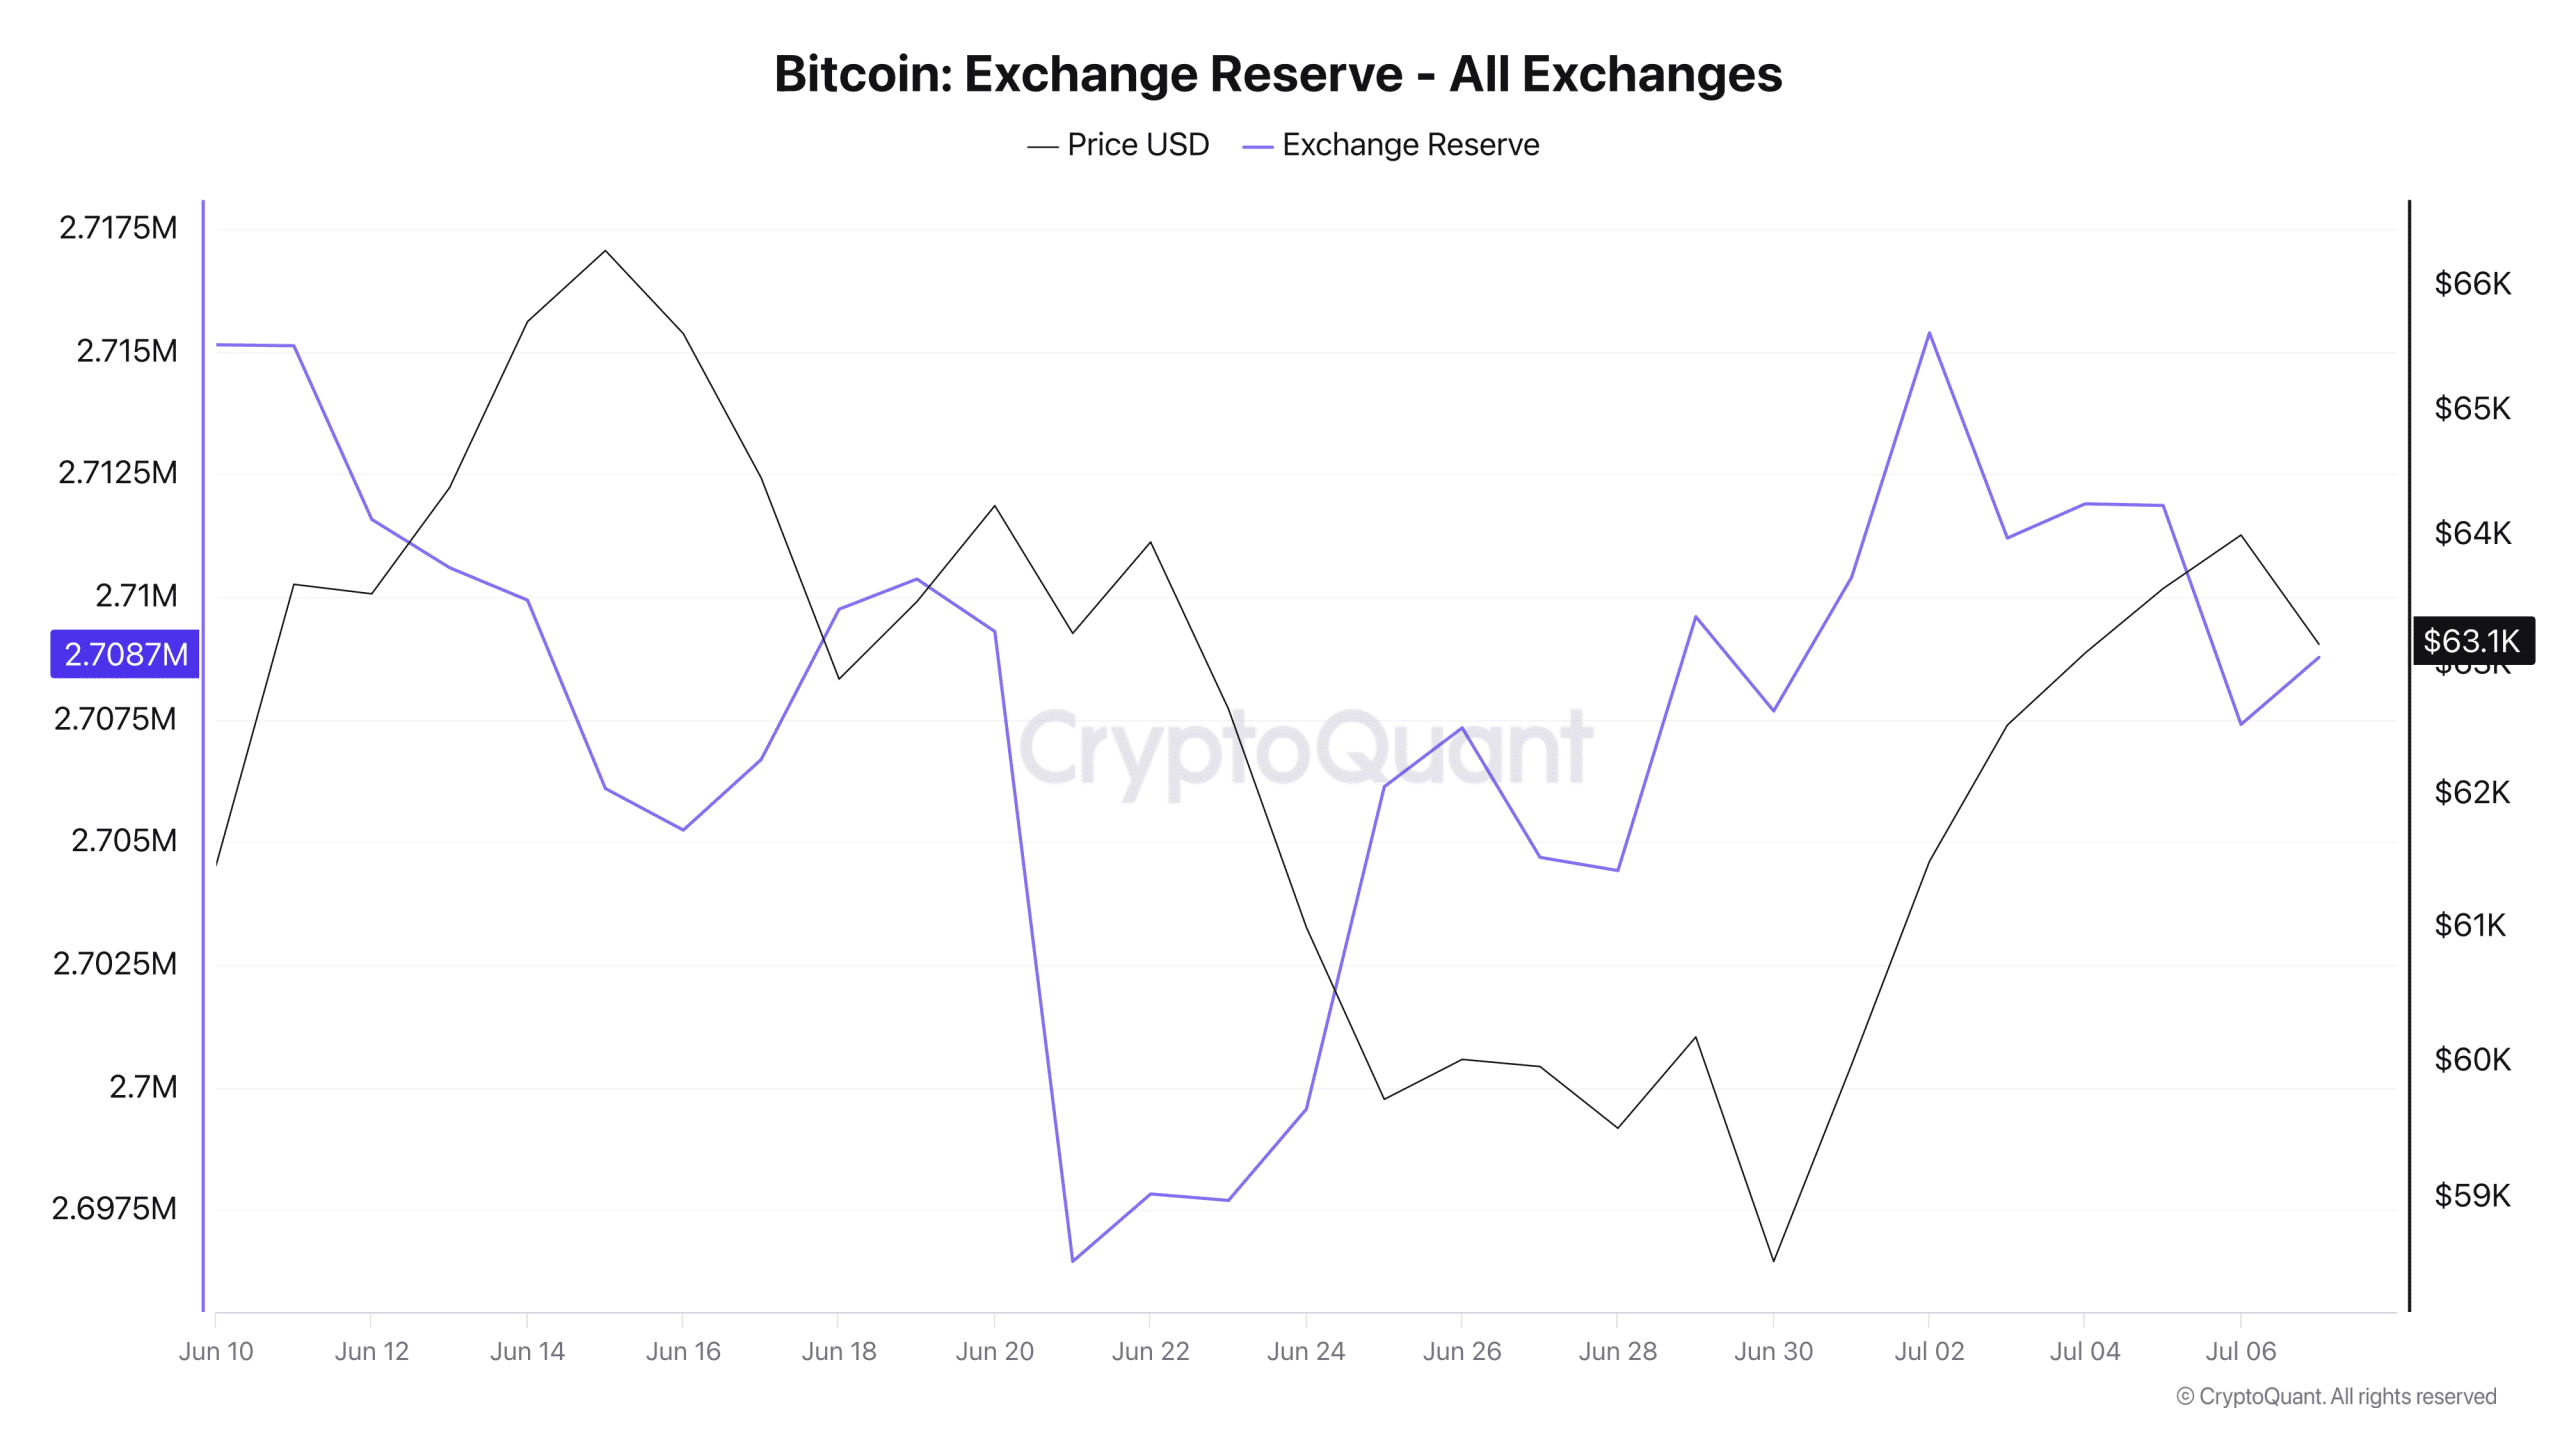
Given the overall decline in supply held in foreign exchange reserves, Bitcoin is likely to face milder selling pressure in its current form. This availability dropped from 2.715 million Bitcoins to roughly 2.707 million on the chart.
For now, capital movement signals that confidence is calming, and Bitcoin looks set to remain calm as the gradual downtrend remains steady.
Final Summary
- Bitcoin remains capped as on-chain data points to accumulation but a confirmed bullish trend reversal.
- Apparent demand is increasing as buyers accumulate BTC, but the metric remains negative, which calls for caution.