

As H2 emerges, liquidity emerges as the determining variable of the market.
From a technical perspective, the value of the TOTAL crypto market is down more than 25% from its peak of $3.3 trillion. This coincided with a nearly 35% decline in Bitcoin (BTC) from its $97,000 peak in the first half; This marked the worst first-half performance since the 2022 bear market, when BTC finished the year down 65%. So if the market sees another H1-style sell-off in the second half, it could match or even exceed the losses in the 2022 bear cycle.
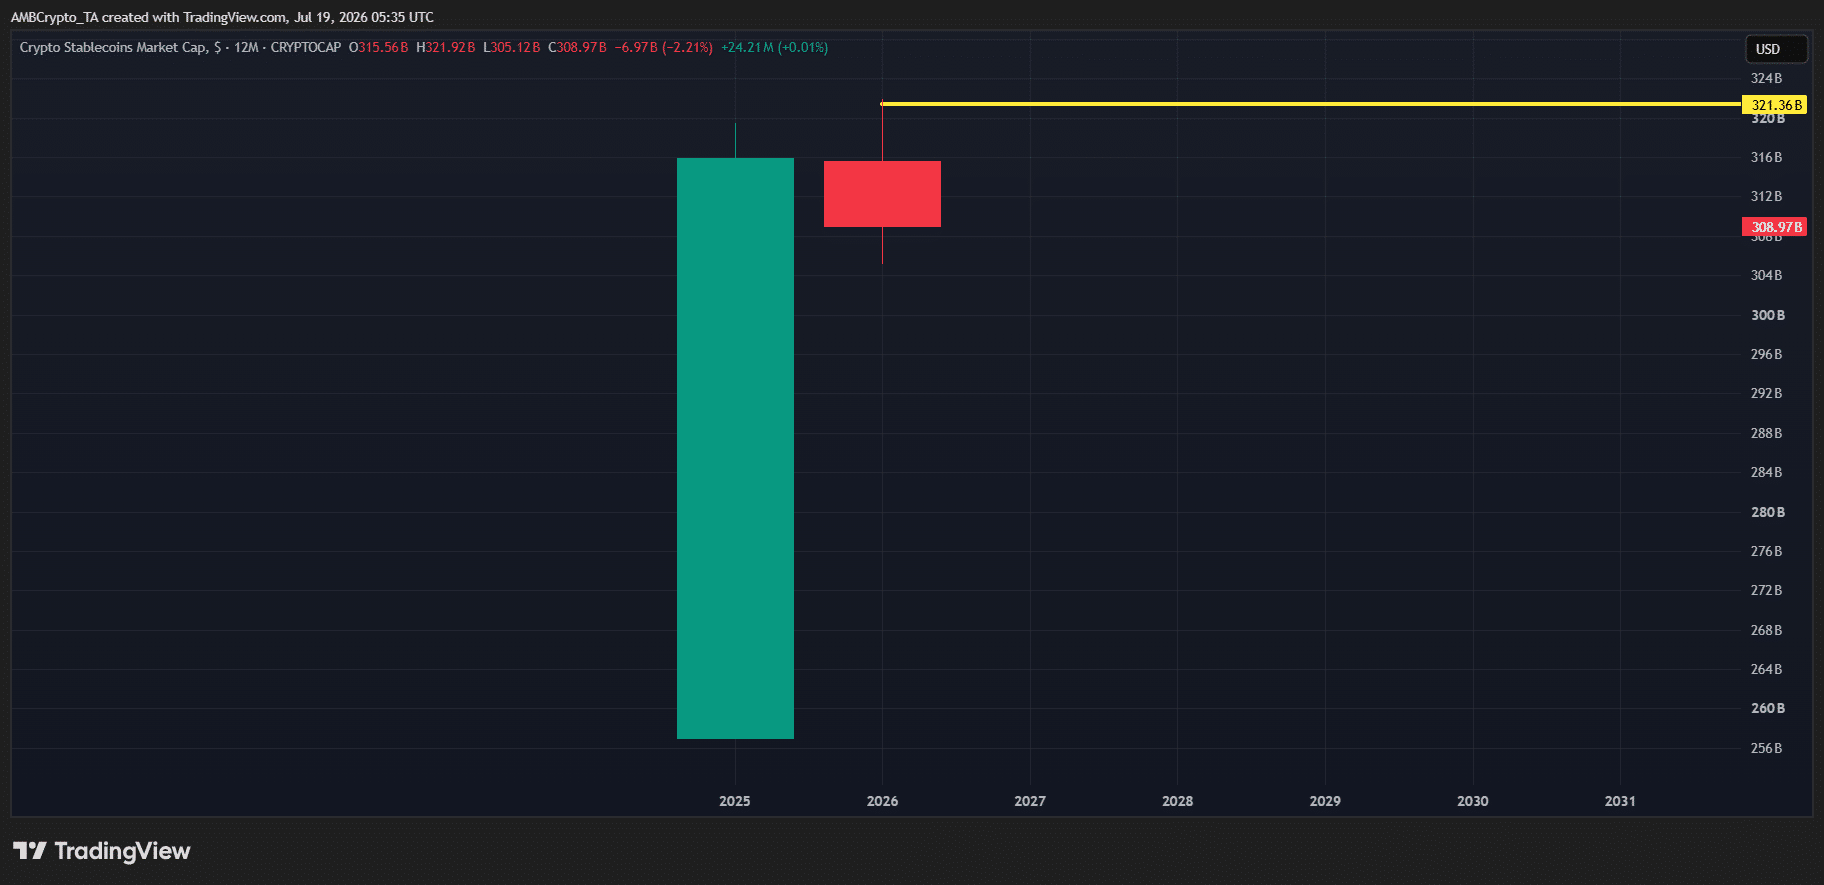
The key question is: What are the possibilities? Liquidity in particular is where the picture begins to change. The stablecoin market has contracted by approximately $15 billion so far in 2026, pushing the total stablecoin market value below $310 billion. Fundamentally, stablecoin outflows indicate that capital is leaving the crypto ecosystem and available liquidity is diminishing to support a sustainable market recovery.
Solana (Sun)But it tells a different story.
According to SolanaFloor, Circle minted another $250 million worth of USDC on Solana in the last 24 hours, pushing the network’s stablecoin market cap to over $15 billion. More importantly, Circle has minted over $70 billion USDC on Solana so far in 2026. Essentially, liquidity continues to flow through the Solana ecosystem while tightening in the broader market.
Notably, this liquidity increase is accompanied by strong on-chain activity. For example, Solana’s monthly active users have risen to over 100 million again; The network added another 37 million monthly active users last month. This alignment between increased USDC supply and increased network usage indicates that fresh liquidity is being deployed rather than sitting idle.
The real question is whether USDC supply emerges as Solana’s key H2 catalyst.
Rising USDC supply reshapes Solana’s H2 outlook
Typically, increased liquidity in the Tier 1 network is a bullish signal.
However, Solana’s price movement has not yet reached the desired level. Despite the sharp increase in USDC liquidity, SOL has underperformed Bitcoin by more than 1.3 times its decline, losing more than 35% in 2026. This difference shows that liquidity alone is not enough to ensure a sustainable recovery.
The same trend is seen in the chain. Solana processed 25.3 billion transactions in the first quarter and 24.3 billion in the second quarter. 4.9 billion transactions have been recorded so far in the third quarter, indicating a slowdown in network activity. The slowdown is also evident in trade activities. As the chart below shows, Solana’s transaction volume dropped 50% quarter over quarter, falling from $410 billion in Q1 to approximately $284 billion in Q2.
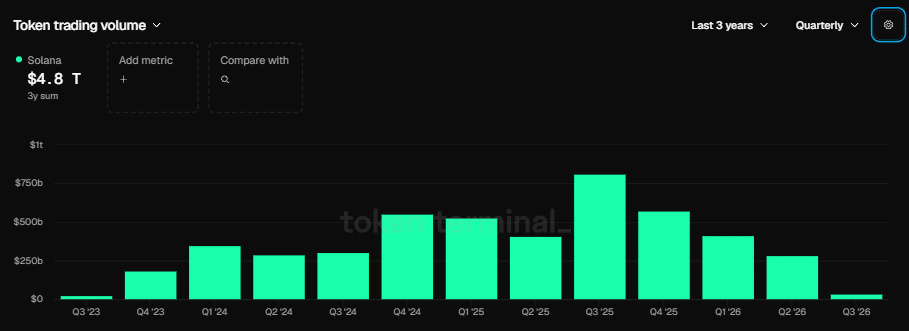
Essentially, increasing USDC supply does not mean increased on-chain activity.
At the same time, monthly active users tell a different story. The difference shows that speculative activity Even though the number of transactions and transaction volume remain below first quarter levels, they are on the rise. This imbalance helps explain the SOL’s technical weakness.
Although Circle minted $70 billion USDC on Solana, liquidity has yet to translate into a meaningful recovery in on-chain activity or sustainable price strength. If speculation continues to dominate, increased USDC supply could become a headwind for SOL and weaken the H2 outlook.
Final Summary
- Circle minted over $70 billion USDC on Solana in 2026, leading to a strong increase in network liquidity.
- However, weaker on-chain activity and SOL’s 35% decline suggest that the extra liquidity is not translating into stronger demand.