

Celestia’s v9.0.4 network upgrade sparked new interest in the market as investors returned following the successful rollout on July 1.
While the blockchain completed the upgrade at a block height of 11,771,698, exchanges briefly paused deposits and withdrawals without disrupting trading activities.
As a result, Celestia (TIA) gained 10.12% in the last 24 hours and was traded near $0.4060 at the time of the move.
Trading activity also strengthened significantly, with daily volume rising 102.19% to $59.5 million. This increase reflected renewed participation rather than a decrease in speculation.
While the rally has been surrounded by excitement, derivatives positions still paint a more cautious picture, creating an interesting contrast between spot participation and futures activity.
Why are futures dealers still active on TIA?
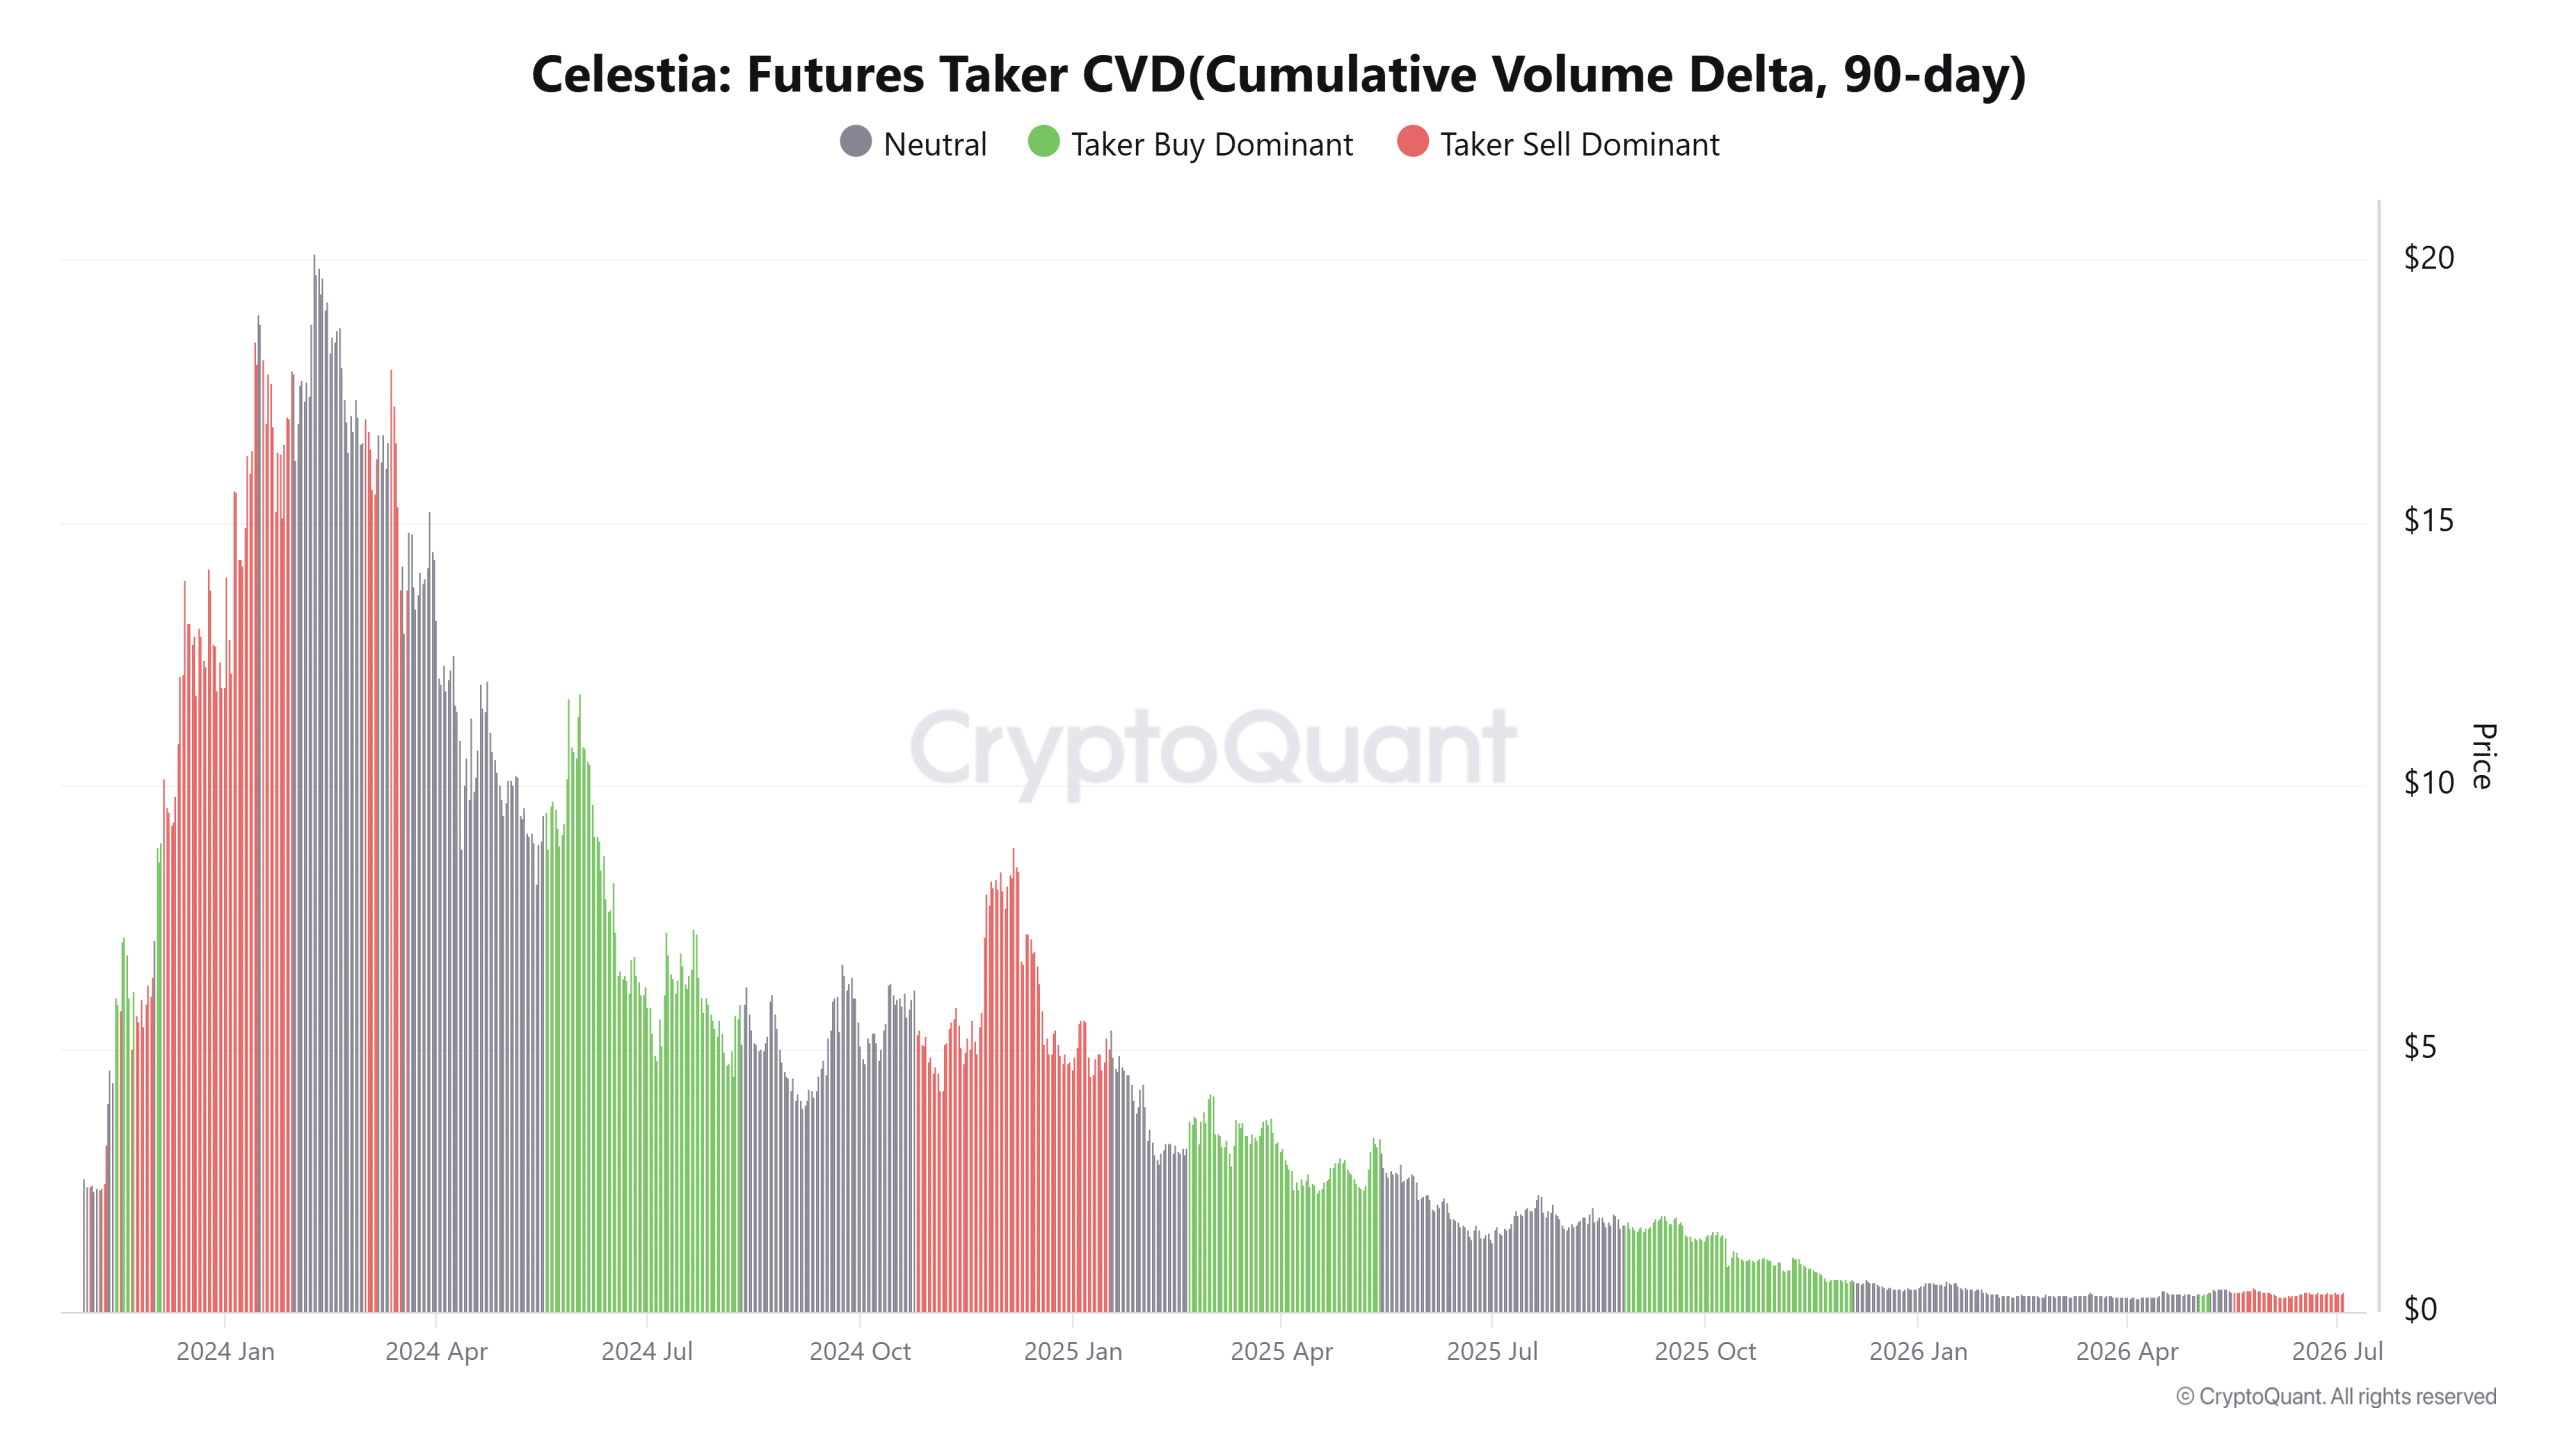
Despite the sharp increase in spot activity, futures traders continued to favor aggressive sell orders throughout the recovery.
90-day Futures Buyer CVD This shows that market participants are repeatedly executing sell orders rather than removing bids.
This behavior suggests that derivatives traders have not fully embraced the rally even as buyers return to the spot market.
But TIA still maintained its gains; This implied that spot demand absorbed most of the selling pressure rather than allowing futures activity to determine the direction of prices. This difference suggests improved market structure, as stronger Spot participation generally provides healthier support than leveraged buying alone.
Despite this, the continued dominance of sellers in futures shows that the downward trend has not completely disappeared.
Why are the bulls still holding on?
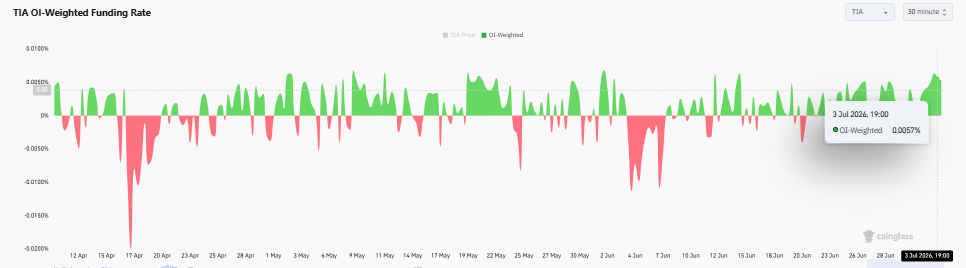
Even though futures traders continued to place aggressive sell orders, leveraged bulls maintained confidence in the funding market.
The OI Weighted Funding Rate remained positive and reached approximately 0.0057%; This shows that long position holders are still paying funds to maintain their exposure.
The reading reflected sustained bullish positioning rather than widespread liquidation among leveraged traders.
Unlike the Futures Taker CVD, which measures executed market orders, the OI Weighted Funding Rate reflected investors’ willingness to pursue directional risks.
Together, the indicators reflected mixed emotions rather than a single market narrative.
While sellers dominated the execution flow, buyers continued to defend long-term exposure, creating a tug of war between conviction and immediate order flow.
Neckline testing takes center stage
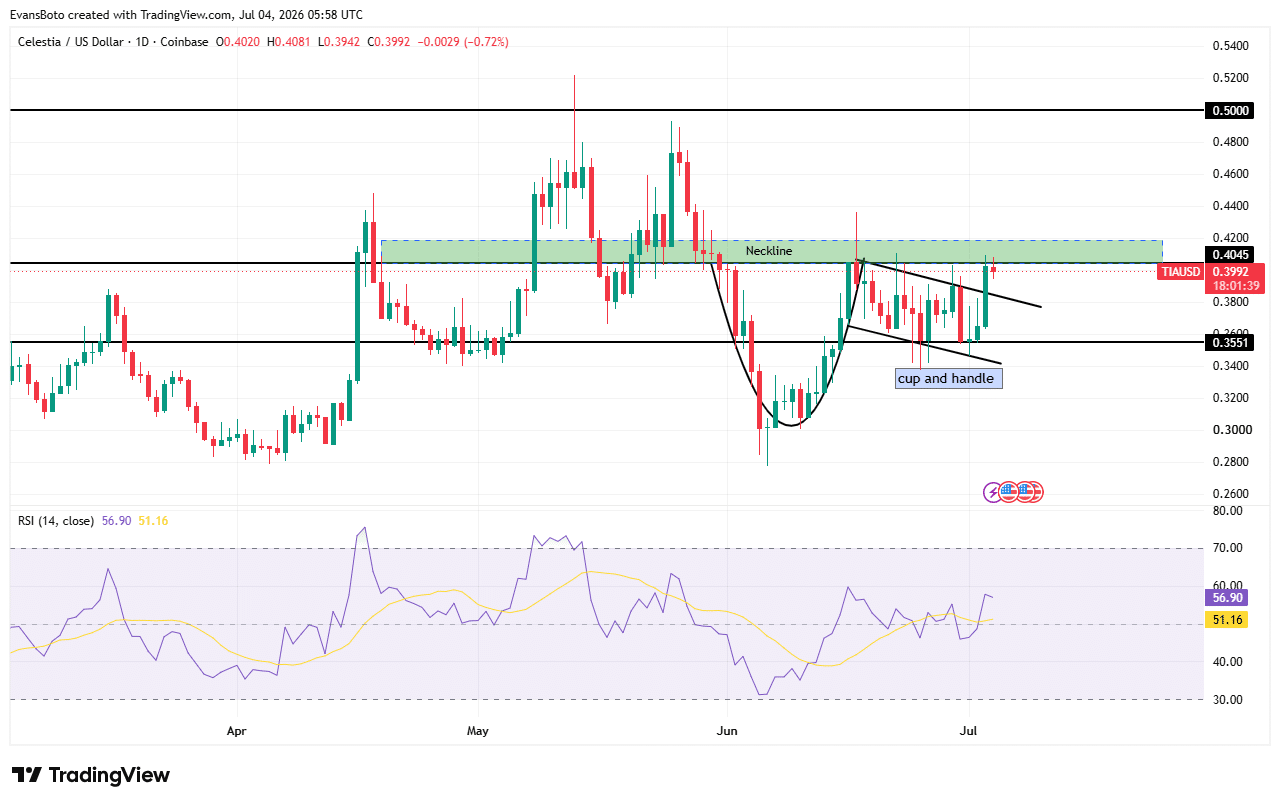
Celestia (TIA) It approached a decisive technical level after completing the cup-handle formation developing below the $0.4045 neckline.
Buyers had already pushed the price towards this resistance after rebounding from June lows of $0.30, strengthening the broader recovery structure.
Meanwhile, the handle developed within a falling channel before the price broke above its upper limit, reinforcing the evolving chart structure.
The Relative Strength Index (RSI) climbed to 56.90 while its moving average remained near 51.16; This suggests that buying momentum is strengthening before reaching overbought conditions.
The price also maintained the bullish structure formed during the recovery and remained comfortably above the $0.3551 support.
Yet the neckline remained the defining barrier, as repeated rejections had previously interrupted upward progress.
A confirmed daily close above $0.4045 will likely confirm the pattern and expose $0.5000 as the next major resistance.
Final Summary
- While Celestia’s upgrade boosted spot demand, futures traders continued to sell into the rally.
- Positive funding and improving chart structure kept breakout hopes alive above major neckline resistance.


